On this page
- How does spark OES generate and read the emission spectrum?
- How should metal samples be prepared for spark OES analysis?
- Where should burn spots be placed on a metal sample for OES, and how many are needed?
- What is the difference between standardization and type standardization in spark OES?
- What are the limitations of spark OES for carbon and sulfur analysis?
- What are common practical pitfalls and quality control measures in spark OES?
- Key takeaways
Optical Emission Spectroscopy (OES) for Metal Analysis
How spark optical emission spectroscopy (OES) delivers rapid quantitative elemental analysis of metals. Covers sample prep, burn placement, standardization and limitations for carbon and sulfur.
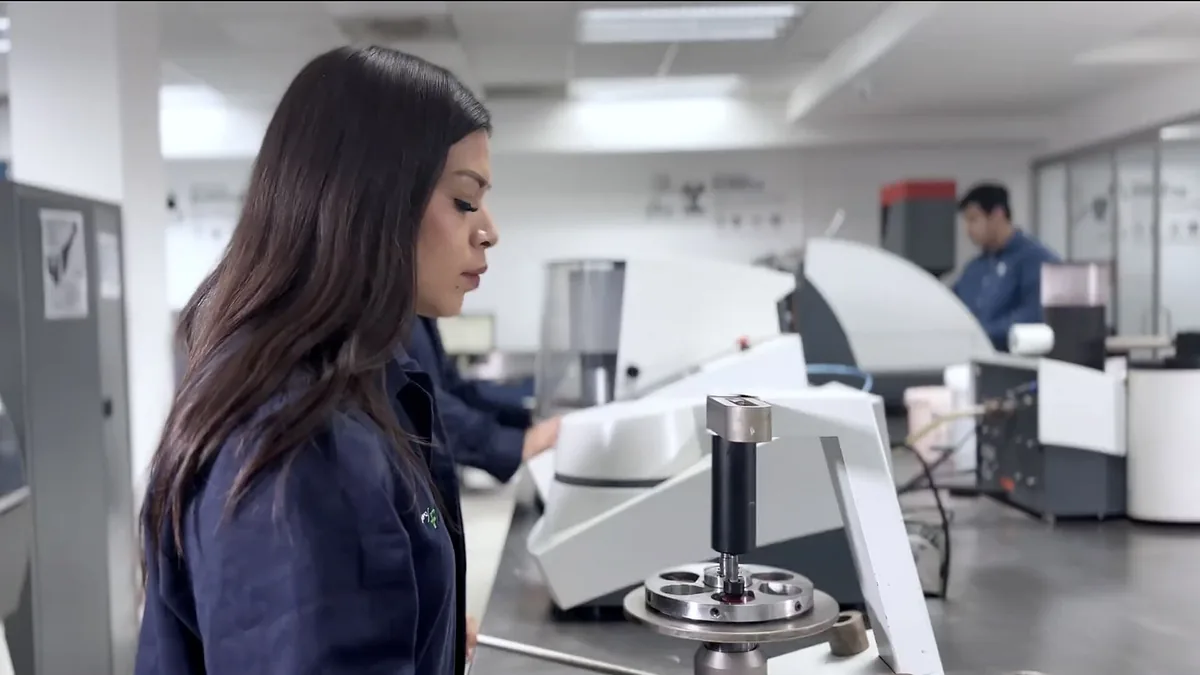

How does spark OES generate and read the emission spectrum?#
Spark optical emission spectroscopy (OES) generates a spectrum by applying a high-voltage, high-frequency electrical discharge between a tungsten or silver electrode and the prepared metal surface within an argon-flushed gap. The discharge creates a plasma that vaporizes, atomizes, and excites sample atoms; as electrons return to ground states, they emit light at element-characteristic wavelengths.
As the excited electrons return to their ground states, each element emits light at characteristic wavelengths. Iron, for example, emits a complex forest of lines throughout the ultraviolet and visible spectrum, while chromium produces prominent lines around 267.7 nm, 298.9 nm and 425.4 nm. The intensity of each emission line is proportional to the concentration of that element in the sample.
The instrument collects this emitted light through an entrance slit or fiber optic and directs it to an optical system consisting of a diffraction grating or prism. The grating disperses the light into its constituent wavelengths, much like a prism splits white light into a rainbow, but with far higher resolution. An array of photomultiplier tubes (in older simultaneous instruments) or charge-coupled device (CCD) detectors (in modern systems) measures the intensity at each analytical line.
The Calibration Curve and Matrix Effects#
The raw intensity at a given wavelength is not directly convertible to concentration. The relationship between intensity and concentration is influenced by the presence of other elements, a phenomenon known as matrix effect or interelement interference. For instance, the intensity of the silicon 288.1 nm line in steel is subtly affected by the iron, chromium and nickel content of the matrix. Carbon emission is influenced by the concentration of other interstitial elements.
To account for this, the instrument manufacturer develops a master calibration using hundreds of certified reference materials (CRMs) spanning the entire composition range the instrument is designed to cover. Sophisticated regression algorithms, often proprietary, model the intensity-concentration relationship including cross-element corrections. This is why an instrument calibrated for low-alloy steels cannot simply be used for high-nickel alloys without selecting the appropriate calibration program.
How should metal samples be prepared for spark OES analysis?#
Proper sample preparation for spark OES requires grinding to a flat, clean surface with a consistent finish using a stationary belt or disc grinder and a 60-80 grit aluminum oxide or zirconia-alumina abrasive. The spark burn depth of 10-30 µm means any surface contamination, oxide scale, or decarburized layer directly affects results.
The Standard Grinding Procedure#
The goal of preparation is to produce a flat, clean, contamination-free surface with a consistent finish. The standard procedure for ferrous and most nonferrous alloys is:
- Select the abrasive: Use a resin-bonded aluminum oxide or zirconia-alumina belt or disc, typically 60 to 80 grit for steels and cast irons. Finer grits (120) may be used for softer alloys like aluminum or copper to minimize smearing. Never use silicon carbide abrasives on ferrous samples; silicon carbide particles can embed and give falsely elevated silicon and carbon readings.
- Use a stationary grinder: A stationary belt grinder or disc grinder with a rigid backing platen is essential. Handheld angle grinders produce uneven surfaces with variable heat input and are unacceptable for quantitative work.
- Apply uniform pressure: Press the sample firmly against the belt or disc, keeping the entire prepared face in contact. The goal is to remove enough material to get below any oxide scale, decarburized layer or surface contamination. For hot-rolled steel, this typically means removing 0.3 to 0.5 mm. The ground surface should show a uniform pattern of parallel scratches with no remnants of the original surface.
- Control heat: Excessive pressure or a dull abrasive generates frictional heat that can cause localized oxidation or even superficial re-austenitization and carbon migration. If the sample becomes too hot to hold with bare fingers, the grinding is too aggressive.
- Clean thoroughly: After grinding, wipe the surface with a clean, lint-free cloth and a solvent such as acetone or isopropyl alcohol. This removes loose abrasive particles, metal dust and any residual oil from handling. Do not touch the prepared surface with bare skin; fingerprints contain sodium, potassium and chloride that appear in the analysis.
Special Cases#
For aluminum and copper alloys, grinding can smear the surface and trap abrasive particles. Some laboratories prefer machining a fresh surface on a lathe or milling machine using carbide tooling. The resulting surface is free of embedded abrasive and provides excellent results, provided the tooling is clean and dedicated to the alloy family being prepared.
For cast iron, the graphite phase presents a unique challenge. Grinding can smear graphite across the surface, creating a false enrichment of carbon at the surface. A light final cut on a milling machine or careful grinding with frequent dressing of the abrasive helps minimize this effect. Regardless of preparation method, the carbon result in cast iron by OES should be interpreted with an understanding of this inherent limitation.
Where should burn spots be placed on a metal sample for OES, and how many are needed?#
Burn spots must be placed on fully dense regions free of cracks, porosity, and segregation. For wrought products, spots are taken along the cross-section away from edges; for castings, avoid areas near chill zones or risers. Standard practice is a minimum of two burns, often three, with results averaged. If the range between individual burns exceeds the specified tolerance, the sample is rejected as inhomogeneous.
Number of Burns and Acceptance Criteria#
A single burn is rarely sufficient for a reported result. Standard practice is to perform a minimum of two burns, and often three, averaging the results for each element. The agreement between burns serves as a built-in check on homogeneity. If the range between individual burn results exceeds a specified tolerance (often defined in the laboratory’s quality manual or by the applicable ASTM standard), additional burns are performed or the sample is rejected as too inhomogeneous for reliable analysis.
Typical burn patterns for common sample types:
- Lollipop or coin samples from molten metal: Two burns on the prepared face, 180 degrees apart.
- Wrought product (bar, plate): Two or three burns along the cross-section, avoiding the extreme edge.
- Weld cross-section: Three burns in a line along the weld centerline, with the burn spots spaced at least 3 mm apart to avoid overlap of the heat-affected zones from previous burns.
What is the difference between standardization and type standardization in spark OES?#
Standardization, or full recalibration, corrects long-term instrument drift by measuring multiple certified reference materials (CRMs) spanning the concentration ranges of interest. Type standardization follows, using a single CRM that closely matches the unknown sample’s composition and metallurgical condition, applying a small offset or slope correction to remove grade-specific bias.
Standardization (Full Recalibration)#
Standardization, sometimes called recalibration or normalization, corrects for long-term drift. The procedure involves measuring a set of certified reference materials (CRMs) that span the concentration ranges of interest. The instrument software compares the measured intensities to the stored values from the original calibration and calculates correction factors (alpha and beta coefficients) for each element.
A typical standardization set for low-alloy steel might include:
| CRM Type | Purpose |
|---|---|
| Pure iron or low-alloy steel with very low residuals | Set the low end of the working curve |
| Low-alloy steel with mid-range Mn, Cr, Ni, Mo | Adjust the slope for common alloying elements |
| High-carbon steel or tool steel | Correct the carbon and higher alloy ranges |
| Resulfurized free-machining steel | Set the high-sulfur end of the curve |
Standardization frequency depends on instrument stability, laboratory environment and the criticality of the work. A daily standardization is common practice, with more frequent checks (every four to eight hours) for high-throughput laboratories or when ambient temperature fluctuates significantly.
Type Standardization (Single-Point Adjustment)#
Type standardization is a finer correction applied after the full standardization. It uses a single CRM that closely matches the unknown sample in both chemical composition and metallurgical condition. The operator measures this CRM and the instrument applies a small offset or slope correction to bring the measured values into agreement with the certified values.
This step is critical because the master calibration, even after full standardization, represents an average over many alloy types. A specific grade, such as 4140 steel, may have a small but consistent bias relative to the general low-alloy steel calibration due to its unique combination of chromium, molybdenum and carbon. Type standardization with a 4140 CRM removes this bias.
The rule of thumb: if you are analyzing a known grade and a closely matching CRM is available, perform a type standardization. If you are analyzing an unknown or a grade for which no close CRM exists, rely on the full standardization and note the potential for a small matrix-specific bias.
What are the limitations of spark OES for carbon and sulfur analysis?#
Spark OES can measure carbon and sulfur to low parts-per-million levels, but the analysis is less robust than dedicated combustion methods. The shallow spark burn makes results sensitive to surface decarburization, graphite morphology in cast iron, and sulfide segregation. For referee analysis or tight tolerances, combustion methods remain the reference.
Surface Sensitivity#
Carbon and sulfur are both highly mobile in steel. During hot working or heat treatment, carbon can diffuse toward or away from the surface, creating a decarburized or carburized layer. Even a few micrometers of decarburization, invisible to the naked eye, can cause a spark OES carbon result to read 10 to 20 percent lower than the bulk value. Grinding must be deep enough to remove this affected layer completely, and verification of adequate removal is not always straightforward.


Sulfur can segregate to grain boundaries and surfaces during solidification. A freshly ground surface may not represent the bulk sulfur content if the grinding action smeared surface sulfides.
Graphite Morphology in Cast Iron#
In gray, ductile and compacted graphite irons, carbon exists both in solution (in the pearlite or ferrite matrix) and as free graphite flakes, nodules or vermicules. The spark plasma vaporizes both forms, but the excitation and emission characteristics differ. The size, shape and distribution of graphite particles affect the carbon signal, meaning two cast irons with identical bulk carbon content but different graphite morphologies can give different OES readings. Combustion analysis, which burns the entire sample, is immune to this effect.
Why Combustion Methods Remain the Reference#
Combustion methods (LECO for carbon and sulfur, or high-temperature combustion with infrared detection) consume a much larger sample mass, typically 0.5 to 1.0 gram, compared to the few milligrams vaporized by a spark burn. This large sample volume averages out microsegregation, graphite morphology effects and surface anomalies. For referee analysis, certification of reference materials and customer specifications with tight carbon or sulfur tolerances, combustion analysis remains the definitive method.
Spark OES complements combustion methods by providing the other 20-plus elements simultaneously. A complete heat chemistry check might use OES for Mn, Si, Cr, Ni, Mo, Cu, V, Ti, Al, Nb and others, while sending a separate pin or chip sample for combustion carbon and sulfur. This division of labor leverages the strengths of each technique.
What are common practical pitfalls and quality control measures in spark OES?#
Key quality-control measures include daily standardization, regular electrode dressing, use of high-purity argon (≥99.998%), and verification with control samples. Common pitfalls are contaminated electrodes, poor argon purity, inadequate sample seal allowing air ingress, and inhomogeneous materials such as free-machining steels or alloys with stable carbonitrides that produce biased results.
Electrode and Argon Condition#
The tungsten or silver counter-electrode must be clean and properly shaped. A contaminated electrode deposits material onto the sample surface or generates erratic sparking. Electrodes should be dressed or replaced on a defined schedule. Argon purity is equally critical; oxygen or moisture in the argon quenches the plasma and suppresses emission lines, particularly for elements in the deep ultraviolet such as carbon (193.1 nm), phosphorus (178.3 nm) and sulfur (180.7 nm). A high-quality argon supply (99.998% or better) with a properly maintained gas delivery system is non-negotiable.
Sample Geometry and Contact#
The sample must make a gas-tight seal against the spark stand aperture. Irregular shapes, small parts or samples with curved surfaces may require an adapter or a different sample presentation approach. Poor sealing allows atmospheric air to enter the spark gap, degrading results for carbon, sulfur and nitrogen.
Inclusions and Segregation#
OES assumes a homogeneous sample. In resulfurized or leaded free-machining steels, the sulfide or lead inclusions are dispersed as discrete particles. A spark burn hitting an inclusion cluster gives a falsely high result for that element. This is why specifications for these grades often allow wider ranges or specify alternative test methods. Similarly, elements like niobium and titanium can form stable carbonitrides that may not fully atomize in the spark plasma, leading to low results for both the alloying element and the associated carbon.
Key takeaways#
- Spark OES provides quantitative analysis of 30-plus elements in under a minute, making it the primary method for alloy verification and heat chemistry in metals production and quality control.
- Proper surface preparation on a stationary grinder with clean, coarse abrasive is essential; the shallow burn depth means any surface contamination, oxide or decarburized layer directly affects the result.
- Standardization corrects for instrument drift using multiple certified reference materials; type standardization with a closely matching CRM removes matrix-specific bias for critical work.
- Carbon and sulfur results by OES are sensitive to sample preparation, graphite morphology in cast irons and surface condition; combustion methods remain the reference technique for these elements when tight tolerances or referee analyses are required.
- Always verify instrument performance with a control sample or CRM at the start and end of each analysis batch, and ensure argon purity and electrode condition are maintained.
Entities in this article
Frequently Asked Questions
What is the typical sample preparation for OES analysis?
The sample surface must be ground to a clean, flat, uniform finish using a coarse abrasive (typically 60 to 120 grit) on a stationary belt or disc grinder. This removes oxides, scale and decarburized layers that would produce unrepresentative results, especially for carbon.
Why does OES sometimes report different carbon values than combustion analysis?
Spark OES measures carbon from a very shallow, localized burn spot, so it is highly sensitive to surface decarburization, graphite form in cast irons and small inhomogeneities. Combustion methods consume a much larger volume of material, averaging these effects and providing a bulk measurement that is often preferred for carbon and sulfur in steels and cast irons.
What is the difference between standardization and type standardization in OES?
Standardization (or recalibration) adjusts the instrument's overall response curve using a set of certified reference materials with known concentrations to correct for long-term drift. Type standardization (or type recalibration) is a single-point or limited adjustment using one certified reference material closely matching the unknown's composition and metallurgical condition to correct for small matrix-specific offsets.
How many burn spots are required for a representative OES analysis?
Industry practice typically calls for at least two to three burns per sample, averaged together. The specific number depends on the material homogeneity, the element of interest and the governing specification; some standards for critical applications require a defined pattern of burns with agreement tolerances between them.